A loaf of bread cost 15,000 VNĐ last year. Now it’s 18,000–20,000 VNĐ1.
What hasn’t changed? My phone buzzing at 9 a.m. to say another $5 of cryptocurrency has landed in my wallet.
Inflation plays whack-a-mole with prices. I’m busy stacking bitcoin.
What I have learned
First, we need to understand what fiat money is.
Fiat money is currency that a government has declared to be legal tender, but it is not backed by a physical commodity like gold or silver. Its value comes from the trust and confidence of the people who use it.
See the problem?
Since it’s not backed by a commodity, the government can print more at will, leading to inflation. Over time, this erodes your purchasing power.
In extreme cases, it leads to hyperinflation—where money becomes nearly worthless. Think Zimbabwe or Venezuela.
Hold that thought. Now let’s take a look at GDP (Gross Domestic Product).
GDP (Y) is the sum of consumption (C), investment (I), government expenditures (G) and net exports (X − M).
Where:
- = Household consumption
- = Business investment
- = Government spending
- = Exports
- = Imports
Note: This is the Expenditure Approach to GDP—one of the most widely used methods.
A growing GDP indicates a healthy economy, while a declining GDP can signal economic problems.
Now let’s focus on Vietnam.
The Vietnamese National Assembly has set an ambitious 8% GDP growth target for 2025.2
So what factors are expected to contribute to this growth?
Let’s start with Consumption (C). This value can only increase if the people buy more goods and services. In theory, there are two simple ways the government can help this happen: (1) Raise people’s incomes. (2) Reduce taxes on goods and services.
With (1), this isn’t so easy right now. In 2025, Vietnam is undergoing a political restructuring meant to streamline the public sector3. This will likely lead to job losses, especially among government workers. The National Assembly approved a budget of 44 trillion VND (≈$1.9 billion) to support this transition4.
With fewer jobs, people will likely cut back on spending. So (1) seems unlikely to help boost consumption.
Now let’s look at (2). Here, the government has made some moves. For example, the 2% VAT reduction—originally temporary—has been extended through June 30, 20255, and there’s a proposal to extend it through 20266.
But clearly, the tax cuts aren’t doing enough. Prices of essential goods and services are still rising, and people feel poorer even with lower VAT.
Adding to this is a surge in counterfeit goods. In just the first four months of 2025, over 34,000 violations were recorded—including fake food, medicines, and even gold7. These undermine consumer confidence and make people more cautious about spending.
I also live in fear that I might consume some products that I will regret later.
So it is clear that the government is trying to boost consumption, but it is not working as expected. The people are still feeling the pinch of rising prices, and the government is looking for more time to see if the tax reduction can help.
Let’s take a look at Investment (I) and Net Exports (X - M) to see if they can help boost GDP.
I group these two factors together because they are both being hit by one major event: Trump 2.0 tariff.
On April 2—what Trump called “Liberation Day”—he announced a minimum 10% tariff on all U.S. imports, with much higher rates for certain countries. Vietnam was hit with a 46% tariff, one of the highest8.

This hurts both investment and exports. Imports (M) rise due to costlier inputs. Exports (X) fall due to retaliation and reduced demand.
To explain the full impact, I asked ChatGPT. Here’s what it said:
ChatGPT Analysis
Analysis (step by step)
-
How big is Vietnam’s exposure to the US?
- Goods the US bought from Vietnam in 2024 were ≈ US $137 billion. (United States Trade Representative)
- Vietnam’s 2024 GDP is estimated at ≈ US $456 billion. (World Economics)
- Therefore, sales to the US equal 30 % of Vietnam’s GDP and ~30 % of all Vietnamese exports. (World Integrated Trade Solution)
-
What does a 46 % tariff do to US demand?
-
Historical studies put the price-elasticity of US demand for similar imports around -1.3 to -1.7.
-
Using a midpoint (-1.5):
-
Price ↑ 46 % → quantity ↓ ≈ 69 %.
-
Export revenue falls from US $137 bn to about US $42 bn (drop ≈ US $95 bn).
-
-
How much of that revenue is Vietnamese value-added?
- OECD TiVA shows roughly 55 % of Vietnam’s export value is created at home (the rest is imported inputs). (OECD)
- Domestic GDP hit ≈ 0.55 × US $95 bn = US $52 bn.
-
Translate to GDP growth:
- US $52 bn equals ≈ 11 % of Vietnam’s GDP in one stroke.
- Even if firms find other buyers and the volume decline is “only” 50 %, the one-year loss is still ≈ US $38 bn (-8 % of GDP).
- Applying a modest fiscal-multipliers/knock-on factor of 1.3 for layoffs, weaker consumption and lost investment, the full-year GDP impact ranges -6 % to -14 %.
-
Broader side-effects (qualitative):
- Jobs: Electronics, apparel and furniture—the three biggest US-bound sectors—employ ~6 million workers; large layoffs would pressure household spending.
- FDI: Many export-platform investors (Korea, Taiwan, China) chose Vietnam to serve the US market; some production may shift to tariff-free neighbours, stalling new inflows.
- Currency & inflation: A softening đồng (to cushion exporters) would raise import prices for fuel, fertiliser and machinery, nudging domestic inflation up.
- Public finances: Lower customs and corporate-income receipts shrink fiscal space just as social-safety costs rise.
Final conclusion
If the 46 % US tariff stays in place, Vietnam is likely to slide from the ~6 % growth path to a recession of roughly –4 % to –8 % in 2025, wiping US $40-50 billion off national income in the first year alone. Even in a best-case scenario (firms quickly re-route one-third of lost sales elsewhere), growth would slow to barely 1-2 % and living-standards gains would stall. In short:
The tariff shock is big enough to knock a full decade of normal growth off Vietnam’s economy in a single year, unless it is softened or rolled back.
As shown, both I and (X − M) take a hit. That’s totally screwed up, the 8% GDP growth target looks like it is impossible to achieve.
So what was the Vietnamese government’s response to this?”
Vietnam called the tariff “unfair” and “lacking scientific basis”—pointing out that its average MFN tariff is just 9.4%8.
Prime Minister Phạm Minh Chính convened an emergency cabinet meeting9. The General Secretary even offered a 0% tariff on U.S. goods in exchange for lowered tariffs, which Trump publicly praised10 11.
For now, the tariff is suspended for 90 days during negotiations. But the outcome remains uncertain.
I can’t detail it here, but if you’re curious why Vietnam is among the countries with high tariff rates, and why it moved so quickly to negotiate with the US government, you can start with this article and explore further from there.
So almost all of the factors that contribute to GDP growth are not working as expected. Only one factor remains: Government Expenditures (G).
And trust me, this is the easiest component to manipulate, as the government can:
- Raise public wages
- Fund infrastructure
- Offer subsidies
Proof? From July 1, 2024, public sector salaries rose 30%, injecting $1 billion extra per quarter into the economy12.
For 2025, the National Assembly allocated ₫829 trillion (~$32 billion) for public investment13. As of April 30, 99% of that budget had already been assigned to key projects: highways, Long Thanh airport, 5G infrastructure, digital platforms.
If the fiscal multiplier is around 1.2–1.3, this could contribute 2–3 percentage points toward GDP.
But the most important question is: “Where does the money come from?”
It’s taxpayers’ money, of course. The government is using the money that it collects from taxes to fund these projects. This means that the government is essentially borrowing money from the people to pay for these projects.
But what happens if the government can’t collect enough taxes to pay for these projects? The government will have to borrow money from other sources, such as banks or foreign investors. An example of this is the government bonds, which are essentially loans that the government takes out to fund its projects. The government promises to pay back the loan with interest over a certain period of time.
But there is a simpler way to do this, remember the fiat money? The government can simply print more money to pay for these projects. This is known as “monetizing the debt.”
If Vietnam were an island that never imported a single bolt, the money-printer might save the day. But the next mega-project on the docket—the 1,600-km North-South high-speed railway that VinSpeed just pitched—shows how quickly that fantasy collides with hard currency reality.14
| Item | Detail |
|---|---|
| Price tag | ₫1,562 trillion ≈ US $60 billion (excludes land clearance). VinSpeed says it will put up 20% equity and borrow the other 80% from the state at 0% for 35 years.14 |
| Domestic capacity | At a May-14 forum, officials admitted “only about 20 Vietnamese firms can even meet the technical bar” for the project. In other words, the bulk of rolling stock, signaling gear, and system integration will come from overseas suppliers.15 |
| Import intensity | Vietnam imported US $31.36 billion of machinery and equipment in just the first eight months of 2024, 59% of it from China—before a single bullet-train girder was ordered.16 |
Why won’t freshly printed dong cut it?
- Land compensation and Vietnamese salaries? Those can be paid in VND.
- Japanese trainsets, German signaling cabinets, Korean wheel sets, foreign specialists? They invoice in USD, EUR, or JPY—and they expect hard currency.
So the Treasury confronts a three-way fork:
- Dip into foreign-exchange reserves (about US $100 bn) to swap dong for dollars.
- Issue foreign-currency debt (sovereign bonds, multilateral loans, maybe a climate-linked tranche) and service it with future tax revenue.
- Let VinSpeed or its banks borrow abroad, pushing exchange-rate risk onto the project and, ultimately, ticket prices.
Whichever door Hanoi picks, the dong-printing press can cover only the local slice of the bill. The rest must be settled in money the rest of the world accepts.
I don’t know about you, but I don’t want to be the one who pays for this project. I don’t want to be the one who pays for the government’s incompetence.
As you see there is some instability in the economy. And with the current actions of the government, I don’t see any sign that it will get better. The inflation is still rising, and the hyperinflation look like a real possibility.
So I have to ask myself: “What should I do?”
I can’t control the government’s actions, but I can control my own.
Let’s buy Bitcoin
I won’t explain what Bitcoin is here, as you can find a lot of information about it on the internet. I will just say that Bitcoin is a digital currency not controlled by any single government or central bank. And it offers a high degree of security and user control, as transactions are secured by cryptography, and, if you manage your own private keys, only you can authorize access to your funds.
So why do I want to buy now? Why not a year ago? Why not a year later?
I’ve known about Bitcoin since 2016. Back then, I was just a student and didn’t have any money to invest. I remember clicking advertisements on the internet to earn some satoshi (each satoshi represents 0.00000001 BTC). I was so excited when I earned 0.001 BTC (worth about $5 at the time). But back then, I didn’t know what to do with it. Since there weren’t many exchanges to easily buy or sell Bitcoin, I just kept it in my wallet and eventually forgot about it.
I didn’t think much about it again until the COVID-19 pandemic. I was stuck at home and had a lot of free time. I started to learn more seriously about Bitcoin and cryptocurrencies. I read numerous articles, watched many videos, and joined various forums. I learned about the underlying blockchain technology and how it works. I began to see the potential of Bitcoin and how it could change the world. However, at that moment, I still viewed parts of it with skepticism, mostly because things like NFTs, GameFi, and other speculative “shitcoins” made me misunderstand the core value proposition of the crypto world.
Then, in December 2024, I started studying for my Master of Business Administration. I learned about economics, finance, and how governments operate. I studied inflation, hyperinflation, and their devastating effects on people’s lives. I also delved into the history of money and its evolution.
And boom – everything I had learned started to link together. It all began to make sense. I saw the connection between Bitcoin and the broader economy. I understood how Bitcoin could potentially serve as a hedge against inflation.
What ultimately convinced me was the prospect of a “Trump 2.0” administration. As Trump campaigns for the presidency, he has been making bold promises regarding cryptocurrency—and this time, he appears to be backing them up with action.17
One of the most notable proposals is the Strategic Bitcoin Reserve—a government initiative aimed at allowing the U.S. to purchase and hold Bitcoin in its national reserves. This move signals a potential shift in monetary policy, with Bitcoin being treated as a strategic asset, much like gold. It could help hedge against inflation, reduce dependence on fiat currency, and strengthen the U.S.’s position in the rapidly evolving global crypto landscape.18
And now I want to invest in it. The profit is not the main reason I invest in Bitcoin. I want to protect myself from the madness out there.
So, I started digging into research. What strategy should I use? Do I need deep knowledge of technical analysis? Should I rely on indicators to buy and sell? Should I use trading bots?
It turns out I don’t need to master all of those complex aspects right away (at least not now). A simple dollar-cost averaging (DCA) strategy seems sufficient for my current goals. This approach helps mitigate risks from volatility and removes the need for timing the market perfectly, which aligns with my current understanding and long-term perspective.
And yes, I have proof that DCA works. I have run some numbers and found that DCA is a great way to invest in Bitcoin. The risk is acceptable for me.
Before going through the numbers, I want to clarify that I am not a financial advisor. This is just my personal opinion and experience. You should do your own research before making any investment decisions.
Dollar-cost averaging (DCA) is an investment strategy where you invest a fixed amount of money into a particular asset at regular intervals, regardless of its price.
Instead of trying to “time the market” by investing a large sum when prices seem low, DCA involves making consistent purchases over time. This means you buy more shares when prices are low and fewer shares when prices are high.
The main goal of dollar-cost averaging that I see very useful for me is to avoid emotional investing. Take a look at this picture:
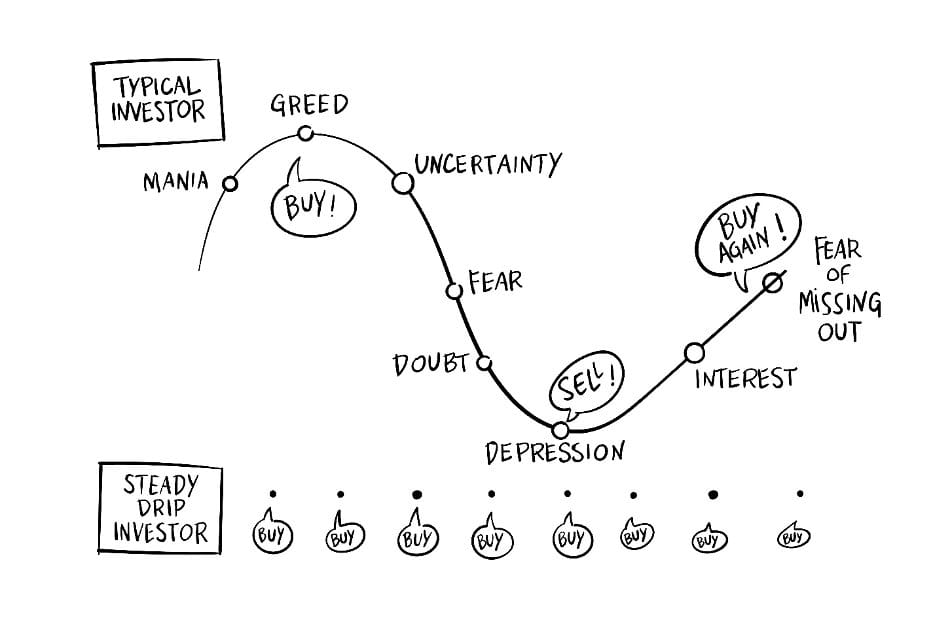
As you can see, if you go to this market and just make a buy, it’s going to be a roller coaster for you. There is too much emotion to deal with. You will be happy when the price goes up, and you will be sad when the price goes down. But if you just buy a fixed amount of Bitcoin every week, you will not have to worry about the price. You can just sit back and relax.
Okay, I see those gears turning! You’re probably asking some great questions right now, like:
- “How much money could I actually make with Dollar-Cost Averaging?”
- “What kind of Return on Investment (ROI) are we really talking about with Bitcoin DCA?”
- “How much would I need to invest regularly to see a meaningful profit down the line?”
These are exactly the kinds of questions that got me digging deeper into DCA. And the most insightful way to explore potential answers isn’t through guesswork, but by looking at how a consistent DCA strategy would have performed based on actual historical price movements.
So, why calculate? Because running these numbers allows us to backtest the DCA strategy. Think of it like this: to understand if a particular game plan in sports is effective, coaches often review past games to see how that strategy played out under real conditions. Similarly, by simulating Bitcoin purchases at regular intervals using historical prices, we can get a data-driven idea of:
- Potential Range of Returns: How did DCA perform during different market phases – bull runs, bear markets, and sideways movements?
- Risk vs. Reward Over Time: Does the risk profile or potential ROI change significantly if you DCA for 1 month versus 1 year, or even 2 years?
- Consistency of Outcomes: How often did DCA lead to a positive return over various time horizons?
Without these calculations, we’re just speculating. By crunching the numbers, we can move from “what if” scenarios to “what would have been” scenarios, which gives us a much more grounded perspective on the potential of DCA for Bitcoin. It helps quantify the possibilities and provides a framework for making more informed decisions, rather than just relying on gut feelings or market hype.
Don’t worry, I’ve got you covered. I’m going to walk you through exactly how I run these numbers to get a clearer picture of what DCA could look like.
First things first, to perform any simulation or calculation, the most crucial ingredient is reliable historical Bitcoin price data. There are many sources to get the price of Bitcoin. I use CryptoDataDownload because it has a convenient download CSV link that I can plug directly into my code for analysis.
The data I use is from Binance Exchange. The data range is from 2017-08-17 to 2025-05-19. I use the daily price data. Here is what it looks like:
| timestamp | open | high | low | close |
|---|---|---|---|---|
| 2025-05-15 00:00:00 | 103508 | 104193 | 101383 | 103764 |
| 2025-05-16 00:00:00 | 103764 | 104550 | 103100 | 103464 |
| 2025-05-17 00:00:00 | 103464 | 103710 | 102612 | 103127 |
| 2025-05-18 00:00:00 | 103127 | 106660 | 103105 | 106454 |
| 2025-05-19 00:00:00 | 106454 | 107109 | 102000 | 105574 |
Where:
- timestamp: The date and time of the price data.
- open: The opening price of Bitcoin on that date.
- high: The highest price of Bitcoin on that date.
- low: The lowest price of Bitcoin on that date.
- close: The closing price of Bitcoin on that date.
With this data in hand, we can start simulating our DCA strategy. The core idea is to see what would have happened if we’d invested a fixed amount of money (say, $1 for simplicity in these calculations) every single day, regardless of Bitcoin’s price on that day. We’ll look at this for different overall investment durations – like 1 week, 1 month, 3 months, and so on, all the way up to 2 years. This way, we can see how the strategy might perform over both short and longer terms.
Here’s a breakdown of the calculation for each of these investment periods (e.g., for a “1-month” DCA simulation):
- Sliding Window: We take our historical data and slide a “window” of the chosen period length (e.g., 30 days for a 1-month analysis) across it. So, the first 1-month window would be Day 1 to Day 30, the next would be Day 2 to Day 31, and so on, until we run out of data. This gives us many different 1-month (or 1-week, 3-month, etc.) scenarios based on all possible historical start dates.
- Daily Investment: For each day within a given window, we assume we invest $1. To figure out how much Bitcoin we “buy,” we divide that $1 by the opening price of Bitcoin on that specific day (1 / open_price). We do this for every day in the window.
- Accumulating Bitcoin: We sum up all these little daily Bitcoin purchases over the entire window (e.g., over all 30 days for a 1-month period). This gives us the total amount of Bitcoin accumulated (crypto_accum) for that specific window.
- Final Value Calculation: At the end of the window (e.g., on Day 30), we take the total Bitcoin accumulated and multiply it by the closing price of Bitcoin on that final day (crypto_accum * end_price). This tells us the total USD value of our Bitcoin holdings at the end of that DCA period.
- Return on Investment (ROI): Finally, we calculate the ROI. The total amount invested is simply the number of days in the period (since we invested $1 per day). The ROI formula is then: ((final_value_usd - invested_usd) / invested_usd) * 100. This gives us a percentage return.
We repeat this process for every possible starting day in our dataset, for each of the defined investment horizons (1 week, 1 month, 3 months, 6 months, 1 year, and 2 years). This generates a whole lot of data points for ROI, which we can then analyze to find averages, medians, the likelihood of positive returns, and other interesting statistics.
This comprehensive approach allows us to build a statistical picture of how DCA might have fared, rather than just looking at one or two cherry-picked examples. Next, let’s dive into what these calculations actually show!
First up, let’s look at some high-level summary statistics. This table gives us a quick snapshot of how Dollar-Cost Averaging into Bitcoin might have performed across different investment horizons, from 1 week all the way to 2 years.
| 1 week | 1 month | 3 months | 6 months | 1 year | 2 years | |
|---|---|---|---|---|---|---|
| samples | 2828 | 2805 | 2745 | 2655 | 2470 | 2105 |
| 2.98% | 9.42% | 17.61% | 40.99% | 100.87% | median_roi_pct | |
| 3.26% | 7.80% | 28.51% | 72.34% | std_dev_pct | 6.24% | |
| 44.62% | 75.89% | 120.85% | min_roi_pct | -42.69% | -47.64% | |
| -49.52% | -55.99% | -51.85% | max_roi_pct | 47.37% | 100.74% | |
| 240.52% | 407.36% | 545.99% | pct_positive | 54.24% | 54.30% | |
| 57.70% | 71.82% | 80.05% |
Where:
- samples: The total number of different DCA simulations run for that time period.
- mean_roi_pct: The average return on investment (ROI) across all simulations for that period.
- median_roi_pct: The middle ROI value if all simulation results were lined up from worst to best. (Half the results were better, half were worse).
- std_dev_pct: Measures how spread out or volatile the returns were. A higher number means more variation in outcomes.
- min_roi_pct: The lowest (worst) ROI observed in any simulation for that period.
- max_roi_pct: The highest (best) ROI observed in any simulation for that period.
- pct_positive: The percentage of simulations for that period that ended with a profit.
Since this post is already long, I won’t go into the details the meaning of each variable. In case you are not familiar with the terms, you can copy the table and paste in into ChatGPT or any other AI tool and start asking questions. It will help you understand the meaning of each column.
Alright, let’s cut to the chase with these numbers. This table shows what history suggests might have happened if we’d consistently dollar-cost averaged into Bitcoin. Looking as the raw table data is not very convenient. So I will add some charts to help visualize the data better.
The main things that jump out are pretty clear. The longer you invest, the higher the average returns. For example, if you DCA for just 1 week, you’re looking at an average return of about 0.73%. But stretch that out to 2 years, and you’re potentially looking at a whopping 100.87% average return! That’s a big difference.
As the investment horizon gets longer – moving from 1 week out to 2 years – both the average (mean_roi_pct) and the typical middle-ground (median_roi_pct) returns tend to climb significantly. For those longer periods, like 1 or 2 years, the average return also pulls noticeably ahead of that median. This tells us that while typical results were good, some massive historical upswings in Bitcoin really boosted the overall average. It’s a classic Bitcoin signature.
Each small chart above shows the distribution of Return on Investment (ROI) for the different DCA periods – from 1 week all the way to 2 years. The height of the bars tells us how frequently certain ranges of ROI occurred in our historical simulations.
- Look at the 1-week and 1-month charts: See how the returns are mostly clustered near zero? There’s a good chunk on the negative side, and the positive side isn’t stretching out too far. This is that near 50/50 chance of profit we saw in the table, visually represented.
- Move to 3 months and 6 months: The distributions start to spread out. We’re seeing more bars appear on the positive side, and they’re inching further to the right, indicating higher potential gains. But there’s still a significant portion of outcomes on the left (losses).
- Now, check out the 1-year and especially the 2-year charts: This is where it gets really interesting. The bulk of the returns clearly shifts to the positive side of zero. That “long tail” stretching out to the right on the 2-year chart? Those are those instances of really high ROIs we talked about – the ones that pull the average up significantly. And while there are still some negative outcomes, they represent a smaller fraction of the total possibilities compared to the shorter periods.
These visuals really drive home the point: as the DCA investment horizon lengthens, not only did the average return historically improve, but the entire distribution of likely outcomes tended to shift towards more favorable territory, with a greater chance of positive returns and the potential for those significant upside wins.
And one more thing. Look at the pct_positive column in the table. It shows the percentage of simulations that ended up with a positive return. For shorter periods like 1 week and 1 month, you’re looking at around 54% of scenarios being profitable. But as you extend that to 2 years, you’re seeing a whopping 80% of scenarios ending in profit! That’s a pretty solid indicator that the longer you stick with DCA, the better your chances of coming out ahead.
Look very promising, right?
But what about the inherent risks? What if, by chance, you began your Dollar-Cost Averaging (DCA) journey immediately before a significant price decline? How would such an event impact your returns?
Let’s examine the worst-case scenario: what happens if your Return on Investment (ROI) drops below 0% after consistently dollar-cost averaging over an entire period?
Well, the outcome might not be as dire as anticipated. While your account value might decrease significantly (e.g., potentially halving 🔻), your overall loss could be contained to approximately 10-30%. This, arguably, could be a more favorable result compared to some scenarios in the stock market.
So, what’s the next step? Should you stop investing and simply hope for a market recovery?
It turns out that by continuing with DCA, your investment horizon naturally extends. A one-week period effectively becomes one month, one month becomes three, and so on. Remarkably, with continued discipline, you could find yourself back in a profitable position sooner than expected. Here is the data I’ve compiled to support this:
| | 1 week | 1 month | 3 months | 6 months | 1 year | 2 years | | :-------------- | -----: | ------: | -------: | -------: | -----: | ------: | | samples | 1294 | 1282 | 1186 | 1123 | 696 | 420 | | recovered_count | 1294 | 1282 | 1186 | 1123 | 696 | 420 | | mean_dtr | 12 | 35 | 62 | 98 | 135 | 114 | | median_dtr | 4 | 14 | 31 | 48 | 122 | 141.5 | | min_dtr | 1 | 1 | 1 | 1 | 1 | 1 | | max_dtr | 290 | 485 | 441 | 368 | 369 | 244 |
Note: “dtr” is shorthand for day-to-recovery.
Now, when you see that ‘recovered_count’ line in the table—showing that in every single one of these past scenarios where DCA started underwater, it eventually broke even—it’s easy to get excited. It kinda makes you think recovery is a done deal, right? And honestly, if you believe (like I do!) that Bitcoin’s price generally marches upwards over time, then yeah, history suggests the odds of your DCA plan bouncing back to at least break-even are incredibly good.
So, with that strong chance of getting back to square one, the next burning question is pretty obvious: ‘How long would I actually have to keep this DCA thing going to get my investment out of the red?’
What really jumps out at me is this: for the shorter DCA stints, like 1 week or 1 month, boom! A lot of recoveries happened super quick (those tall bars on the far left). Love to see it! But then, you also notice those bars stretching further out to the right? Yep, those are the times the market decided to play hard to get, and patience was the name of the game.
Even when you look at the longer 1-year or 2-year DCA periods, while plenty of recoveries are still on the quicker side, there are definitely scenarios where you’d be in for a longer haul. Now, a little heads-up on that 2-year chart specifically: it might look a bit different, maybe the patterns aren’t as sharply defined. That’s mainly because for such a long investment and recovery window, we naturally have fewer fully completed examples in our current historical dataset to draw from. So, think of that 2-year panel as an early glimpse or for general reference – it’s still interesting, but the picture there will likely get even clearer as more time and data accumulate.
It’s a fantastic visual reminder overall, isn’t it? While history shows DCA is a resilient strategy for getting back to even, it’s not always a sprint; sometimes it’s a marathon, or at least an unexpected endurance test! But that’s part of the journey when you’re stacking sats and committed to the long view, right? Onwards!
But let’s be real: those super lengthy recovery sagas we saw in the data? Those were the absolute outliers, the ‘worst-imaginable-timing’ kind of deals. You’d have to have some truly rotten luck, like deciding to start your DCA journey the very day before a massive, unexpected market tumble, to actually get caught in one!
Okay, so that’s the data dump! Impressive stats, for sure. But maybe a part of you is still thinking, ‘That’s all well and good on paper, but it’s just theory, isn’t it?’
Well, I’m not just about theory – I like to see things in action! So, I’ve been ‘playing with my own luck’ (if you can call disciplined DCA ‘luck’ 😉) on my personal Bitcoin journey. I started Dollar-Cost Averaging (DCA) back on January 14th, 2025. As of this post (May 21st, 2025), it’s been just over four months. The chart below tracks the Return on Investment (ROI) specifically from my DCA strategy during this time. Ready to peek at my own numbers and see how it’s actually going? Let’s dive in:
Well, the chart speaks for itself, doesn’t it? My conclusion after these first four months? DCA is definitely working for me! I’m seeing a solid ROI of about 18%.
And the best part? No nerve-wracking attempts to time the market, no agonizing over big investment calls. I just set my disciplined DCA plan and let it do its thing. It’s proof that you don’t need a huge bankroll to start investing; you can begin with small, regular amounts and build steadily from there.
I’ll be keeping you updated on my DCA journey with fresh updates regularly.
Disclaimer: This is not financial advice. Always do your own research before making any investment decisions. The past performance of Bitcoin or any other asset does not guarantee future results. Investing in cryptocurrencies carries risks, and you should only invest what you can afford to lose.
Read more
Footnotes
-
The National Assembly raises GDP growth target to at least 8 per cent for 2025 ↩
-
Vietnam’s Party leader urges revolution to streamline political system ↩
-
Quốc hội chốt bổ sung 44.000 tỷ đồng chi cho sắp xếp bộ máy ↩
-
Chính sách giảm thuế GTGT trong 6 tháng đầu năm 2025 theo Nghị quyết 174/2024/QH15 của Quốc hội ↩
-
Trình Quốc hội giảm thuế VAT đến hết 2026, dự kiến giảm thu khoảng 121.740 tỉ đồng ↩
-
Điểm những vụ án lớn, điển hình về hàng giả trong 4 tháng năm 2025 ↩
-
Trade ministry says Trump’s 46% reciprocal tariff on Vietnam ‘unfair’ ↩ ↩2
-
Cabinet convenes meeting following Trump administration’s announcement of newest tariffs ↩
-
Vietnamese Party chief holds phone talks with US President ↩
-
Trump praises Vietnam’s offer of ‘0%’ tariff on American goods ↩
-
Vietnam to consider Vinspeed proposal to build high-speed railway ↩ ↩2
-
High-speed rail project spurs call for domestic supply chain development: Forum | Vietnam+ (VietnamPlus) ↩
-
Machinery and equipment import markets in first 8 months of 2024 ↩
-
Trump’s Crypto Revolution: Promises Kept And Controversies Ignited ↩
-
ESTABLISHMENT OF THE STRATEGIC BITCOIN RESERVE AND UNITED STATES DIGITAL ASSET STOCKPILE ↩